103
Explanation Section
400
B
500 600 700
G
R
R
X
2R
R
YR
R
ZR
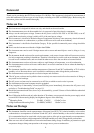
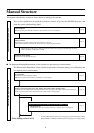
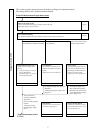
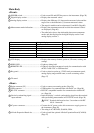
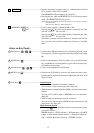
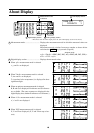
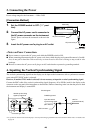
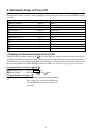
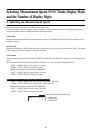
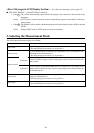
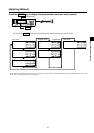
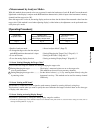
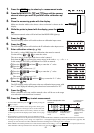
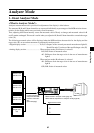
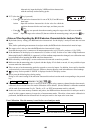
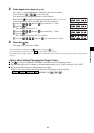
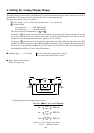
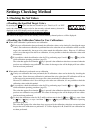
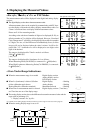
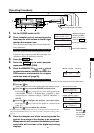
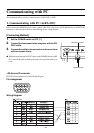
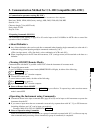
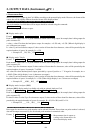
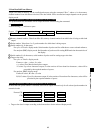
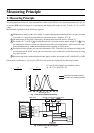
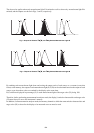
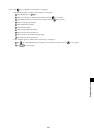
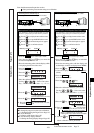
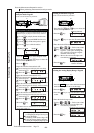
Fig. 1 Display’s Spectral Distribution and Sensor’s Spectral Sensitivity
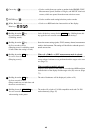
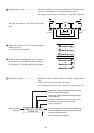
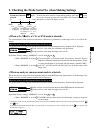
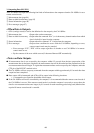
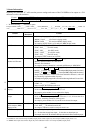
Fig. 2 Outputs of Sensors
–
x
2
λλ
λλ
λ,
–
y
λλ
λλ
λ, and
–
z
λλ
λλ
λ by Emitted Monochrome Light R
Wave length (nm)
Relative sensitivity
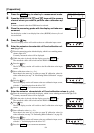
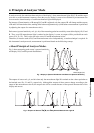
4. Principle of Analyzer Mode
In analyzer mode, the emission characteristics of the display’s three monochrome lights (R, G, B) and the target
color are set to the instrument’s memory. Once they are set, display’s screen colors obtained by measurement can
be converted to beam intensity of each monochromatic light and displayed.
For instance, if beam intensity of R among R, G and B is adjusted, only the output of R will change and the outputs
of B and G will remain the same, making white balance adjustment easy (white balance measurement is performed
by adjusting the output of a monochrome color).
Each sensor (spectral sensitivity:
––
x
2λ,
–
yλ,
–
zλ) of the measuring probe has sensitivity towards the display’s R, G and
B. Thus, even if R monochrome light is emitted on the display’s screen, an output will be provided from each
sensor (
–
x
2λ,
–
yλ,
–
zλ). This is also true in the case of G and B monochrome colors.
Therefore, to measure each of R, G and B monochrome colors independently, a certain technique is required. In
this instrument’s analyzer mode, measurement is performed based on the following concept.
<About Principle of Analyzer Mode>
Fig. 1 shows measuring probe sensor’s spectral sensitivity
and display’s R, G and B spectral distributions.
The outputs of sensors
––
x
2
λ,
–
yλ, and
––
zλ when only the monochrome light R is emitted are the values equivalent to
the hatched areas X
2R
, Y
R
and Z
R
, respectively. Although the outputs of these sensors change according to the
output of the monochrome color R, the output ratio will be constant because of the spectral characteristic of the
display and sensors.