


Operating the Analyzer
24 UDA2182 Universal Dual Analyzer Product Manual January 2009
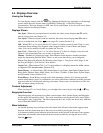
Online Functions
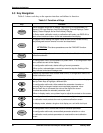
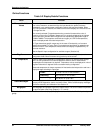
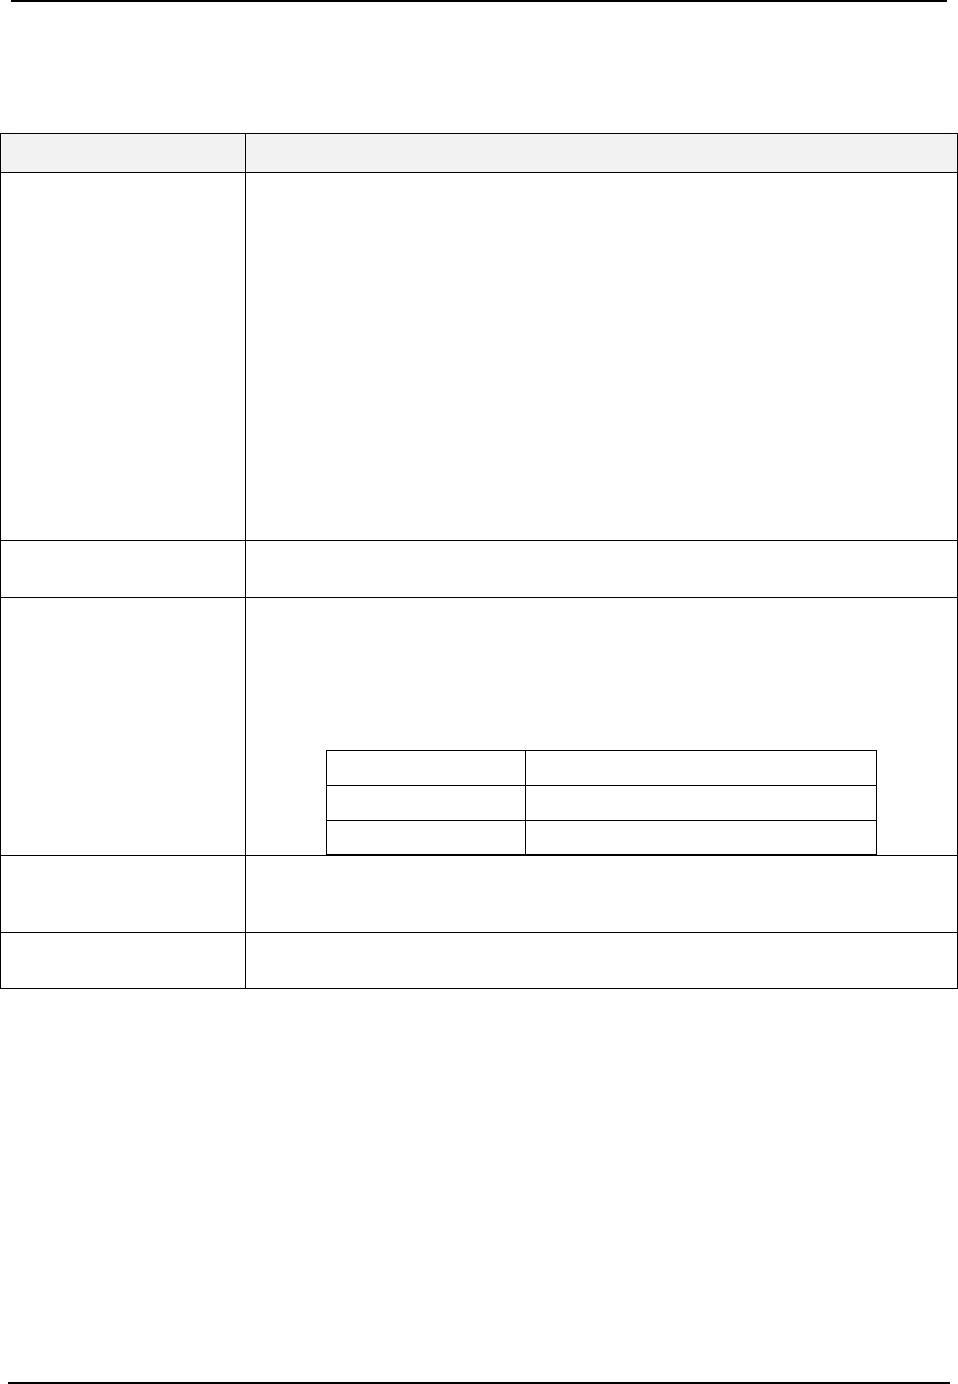
Table 5-2 Display Details Functions
Detail Function
Process Variable
Values
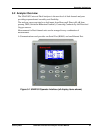
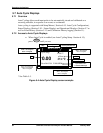
When two input boards are installed, the default online screen displays both PVs and
their units of measure, as determined by the input boards, the probe (if memory-
embedded) or any measurement configuration options that may be available. When
only one input board is installed, the default online screen displays one PV and its units
in a larger font size.
The currently selected PV type determines the numerical format and the units of
measure on the online PV display. Measured PV is generally displayed in the highest
decimal precision possible with five digits and has a potentially displayable range of
0.0000 to 99999. The exceptions are dissolved oxygen, pH, ORP and temperature,
which are displayed with fixed decimal precision.
PV Type determines specific ranges and in the case of Conductivity, cell constant
determines available PV Types. Each PV measurement and display is updated every
500ms maximum. Each temperature measurement and display is updated every 10
seconds maximum.
See the Specific Input configuration for available ranges. (Section 6.6)
Tag Name
The real-time displays of process values show the instrument’s tag name (or other
configurable fixed sixteen-character string) at the top of the screen.
PV Temperature
Each PV value is accompanied by a temperature value for all measurements except
ORP, as ORP probes do not contain temperature sensors and no measurement
compensation for temperature is required. Temperature values are displayed in units of
degrees Fahrenheit or degrees Celsius as determined by configuration.
Measured temperature is always expressed in fixed tenths decimal precision and has a
displayed range according to input type:
PH/ORP
-10.0 to 110.0°C or 14.0 to 230.0°F
Conductivity
0 to 140.0°C or 32.0 to 284°F
Dissolved Oxygen
0 to 60.0°C or 32 to 140°F
Status Messages
A text string appears on the bottom of all displays. Online displays provide messages
relaying online diagnostics, alarms and other events. Offline screens display messages
relevant to data entry and calibration. See Section 12.
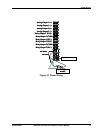
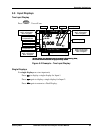
Bargraphs
The Bargraphs will represent up to three output values. The corner indicators represent
the physical state of the Relay Outputs [1, 2, 3, and 4].
*Note that all values and indicators on the main (input) display screen are maintained in the input setup
group.