


FFT
F&t
Fourier Transform
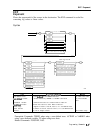
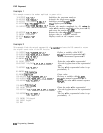
OUTPUT
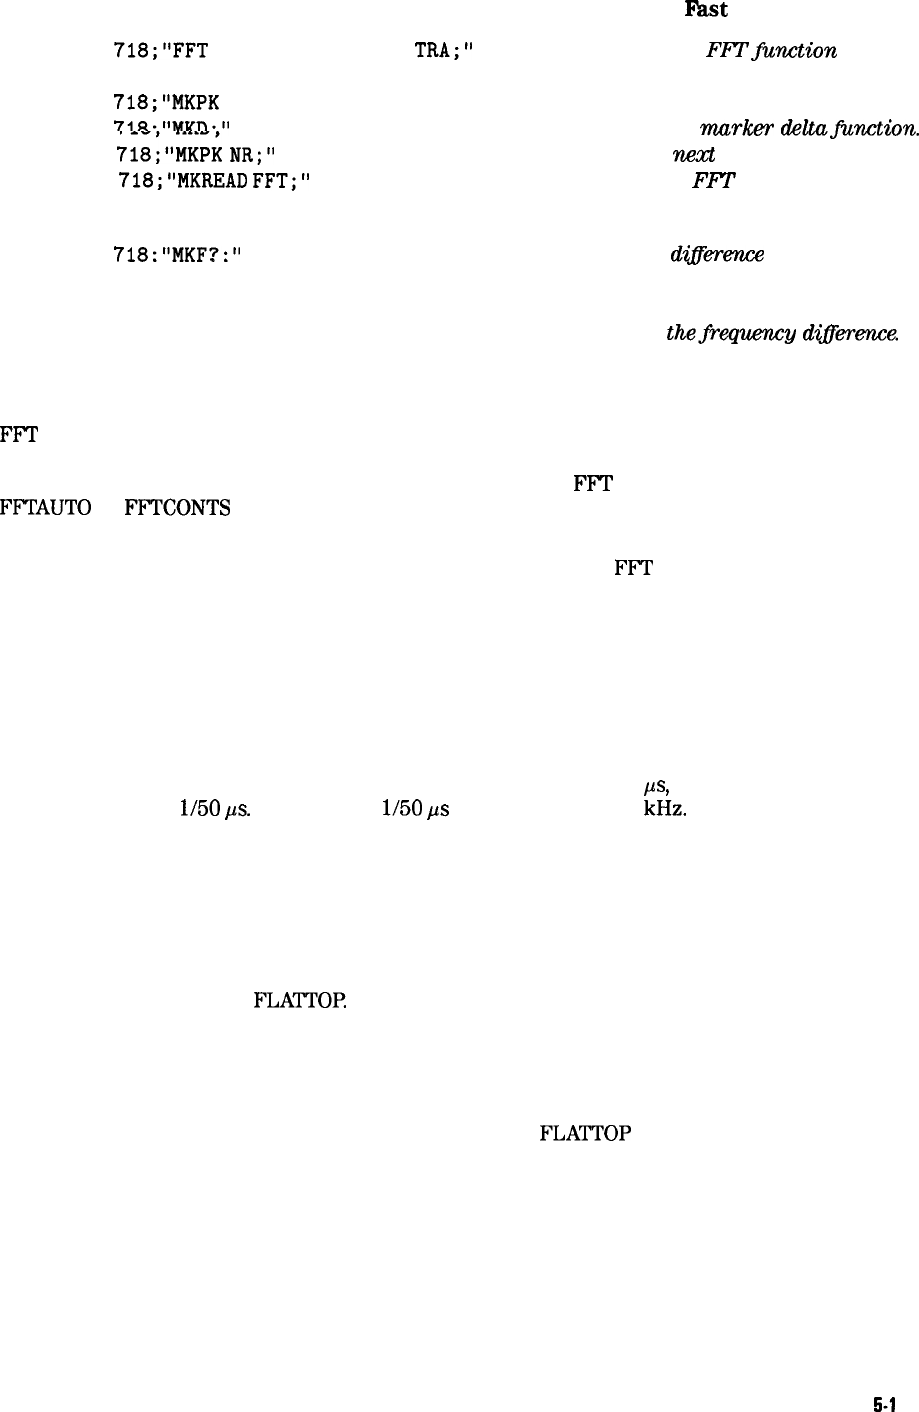
718;"FFT
TRA,TRA,TRB;VIEW
TRA;"
OUTPUT
718;"MKPK
HI;"
OUTPUT
718."MKD."
OUTPUT
718;"MKPi
NR;"
OUTPUT
718;"MKREAD
FFT;"
OUTPUT
718."MKF'."
,
*
,
ENTER 718;A
DISP A
Executes the
FFTjimction
with the
trace window function.
Finds the highest signal.
Activates the
marker
deltajim%ion.
Finds the next peak to the right.
Selects the FFl’ marker to display
the marker delta value as a fre-
quency instead of time value.
Finds the dz@rence between the two
peaks.
Displays thefrequency
d@Lmnce.
Description
FFT
weights the source trace with the function in the window trace (the window trace is
described below). The transform is computed and the results are placed in the destination
trace. Unlike FFTAUTO and FFTCONTS, FFT performs the
FFI’
measurement only once. Use
FFTAUTO
or
FFI’CONTS
if you want the FFT measurement to be performed at the end of every
measurement sweep.
The spectrum analyzer should be in linear mode when using the
FF”I’
command. The FFT
results are displayed on the spectrum analyzer in logarithmic scale. For the horizontal
dimension, the frequency at the left side of the graph is 0 Hz, and at the right side is Fmax.
Fmax can be calculated using a few simple equations and the sweep time of the spectrum
analyzer. The sweep time divided by the number of trace array elements containing amplitude
information is equal to the sampling period. The reciprocal of the sampling period is the
sampling rate. The sampling rate divided by two yields Fmax.
For example, let the sweep time of the spectrum analyzer be 20 ms and the number of trace
elements be 400. The sweep time (20 ms) divided by 400 equals 50
ps,
the sampling period.
The sample rate is l/50
ps.
Fmax equals l/50
p.s
divided by 2, or 10
kHz.
FFT is designed to be used in transforming zero span information into the frequency domain.
Performing FF’T on a frequency sweep (when the frequency span is greater than zero) will not
provide time-domain results.
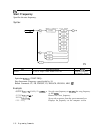
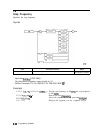
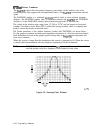
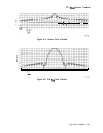
The windowing function stored in the window trace may be selected with the trace window
(TWNDOW) command or you can store your own values in that trace. The trace window
function modifies the contents of a trace array according to one of three built-in algorithms:
UNIFORM, HANNING, or
FLATTOI?
See Figure 5-4, Figure 5-5, and Figure 5-6. The TWNDOW
command multiplies a trace array with one of these windows.
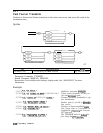
Selecting a window: The amplitude and frequency uncertainty of the Fourier-transformed
display depends on both the choice of trace windows and the spectrum analyzer sweep time.
Amplitude uncertainty is maximum when the spectral component falls midway between the
filter shapes. Passbands that are flatter in shape, like the
FLATTOP
filter, contribute less
amplitude uncertainty, but frequency resolution and sensitivity are compromised.
The UNIFORM window algorithm has the least frequency uncertainty and greatest amplitude
uncertainty. The UNIFORM window does not contain time-domain weighing and leaves the
data alone. Use the UNIFORM window for transforming noise signals or transients that decay
within one sweep time period. The UNIFORM window yields the best frequency resolution, but
also produces the highest side lobes for periodic signals.
Programming Commands
5-l
61