


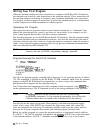
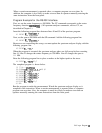
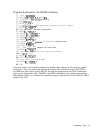
Finally, we print the values on the computer screen:
"THE SIGNAL PEAK IS . . .
dBm
AT . . . MHz"
Before we end the program, we return the spectrum analyzer to continuous-sweep mode and
local control.
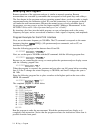
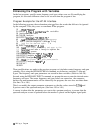
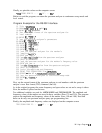
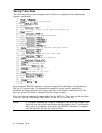
Program Example for the RS-232 Interface
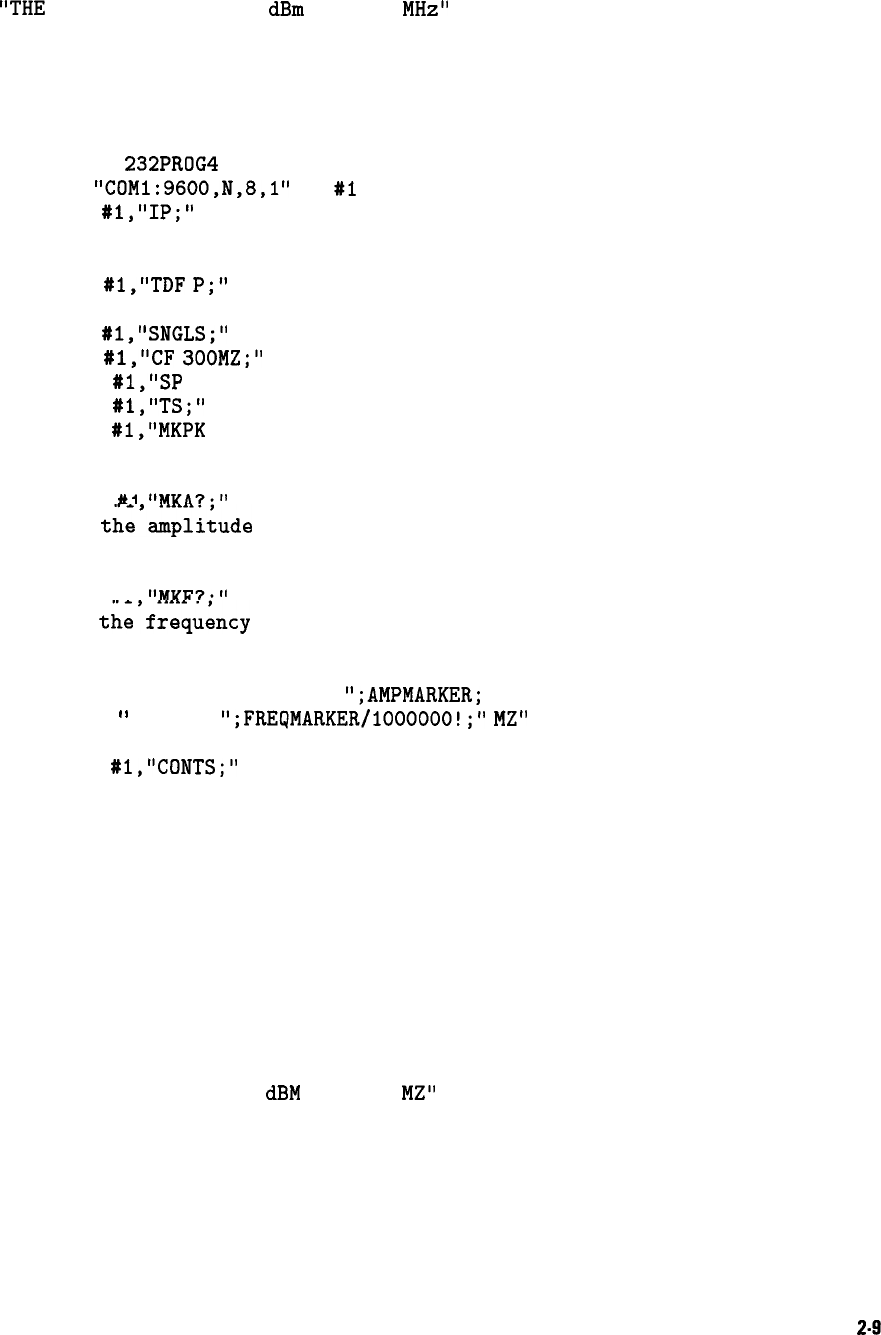
10 'File
=
232PROG4
20 OPEN
"COMl:9600,N,8,1"
AS
#l
30 PRINT
#l,"IP;"
40 'Set the output format of the spectrum analyzer for
50 'real numbers
60 PRINT
#l,"TDF
P;"
70 'set the spectrum analyzer's parameters
80 PRINT
#l,"SNGLS;"
90 PRINT
#l,"CF
300MZ;"
100 PRINT
#l,"SP
200MZ;"
110 PRINT
#l,"TS;"
120 PRINT
#l,"MKPK
HI;"
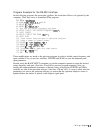
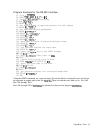
130 'ask the spectrum analyzer for the marker's
140 'amplitude value
150 PRINT
#l
"MKA'."
160 'get
the'ampli&rde
from the spectrum analyzer
170 INPUT #l,AMPMARKER
180 'ask the spectrum analyzer for the marker's frequency value
190 PRINT #1
"MKF'."
200 'get
the'freq&cy
value from the spectrum analyzer
210 INPUT #l,FREQMARKER
220 'print the amplitude and frequency
230 PRINT "THE SIGNAL PEAK IS
";AMPMARKER;
240 PRINT
"
dbm AT
";FREQMARKER/lOOOOOO!;"
MZ"
250 'set the spectrum analyzer to continuous sweep mode
260 PRINT
#l,"CONTS;"
270 END
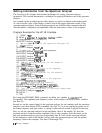
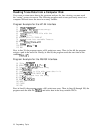
First, set the output format of the spectrum analyzer to real numbers with the spectrum
analyzer’s trace data format (TDF) command (line 60).
As in the original program, the center frequency and span values are set and a sweep is taken.
Next, the marker is placed on the trace.
Two additional variables are used for AMPMARKER and FREQMARKER. The amplitude and
frequency values of the marker are stored in these variables (lines 170 and 210). The program
requests the amplitude and frequency values of the marker (lines 150 and 190). Note that
there can be only one spectrum analyzer query per programming line.
Finally, the amplitude and frequency values are displayed on the computer screen:
"THE SIGNAL PEAK IS . . .
dBM
AT . . . MZ"
Writing a Program
2-9