


PEAKS Peaks
Example
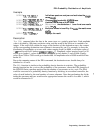
Connect CAL OUT to the spectrum analyzer input.
OUTPUT
718."IP*"
OUTPUT
718;"CF'300MHZ;SP
1500MHZ;RB
30KHZ;SNGLS;"
OUTPUT
718;"TH
-60DM;MKPX
10DB;TS;"
OUTPUT
718;"PEAKS
TRB,TRA,FRQ?;"
ENTER
718;Number
DISP Number
FOR
I=1
TO Number
OUTPUT
718;"MKP
TRB[";I;"]";
OUTPUT
718;"MKA?;"
ENTER
718;A
OUTPUT
718*"MKF'*"
ENTER
718;;
*
9
PRINT A,B
NEXT I
Initializes spectrum analyzer
Changes the center frequency,
span, bandwidth.
Actiuatessingle-
sweep mode.
Sets up threshold, sets mini-
mum peak excursion.
Returns the number of peaks in
trace A above the threshold.
Gets the number of peaks from
the spectrum analyzer
Displays the result on the com-
puter screen.
Fbr
one to the number of peaks
do
the following steps.
Place marker at the position of
the first trace B element.
Find the amplitude of the marker
Find thefrequency of the marker
Print the amplitude and the
frequency of the marker
Repeat the FOR NEXT loop for
all of the peaks that werefound.
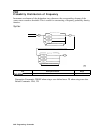
Description
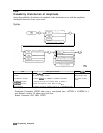
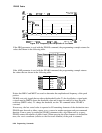
When sorting by frequency (FRQ), PEAKS first computes the horizontal position of all peaks.
These positions are loaded into the destination trace consecutively, with the lowest frequency
value occupying the first element. Thus, signal frequencies, from low to high, determine the
amplitude of the destination trace from left to right.
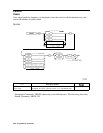
When sorting by amplitude (AMP), PEAKS first computes the amplitudes of all peaks in the
source trace in measurement units, and sorts these values from high to low. The positions of
the peaks are then loaded into the destination trace, with the position of the highest amplitude
value occupying the first element.
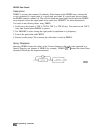
For example, executing the programming example results in the following spectrum analyzer
display:
Programming Commands 5-425