Programming Function Blocks and Features
Video Recorder – User Manual 123
Function Generator
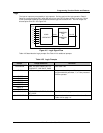
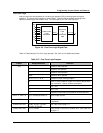
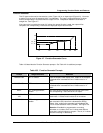
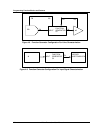
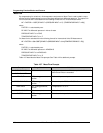
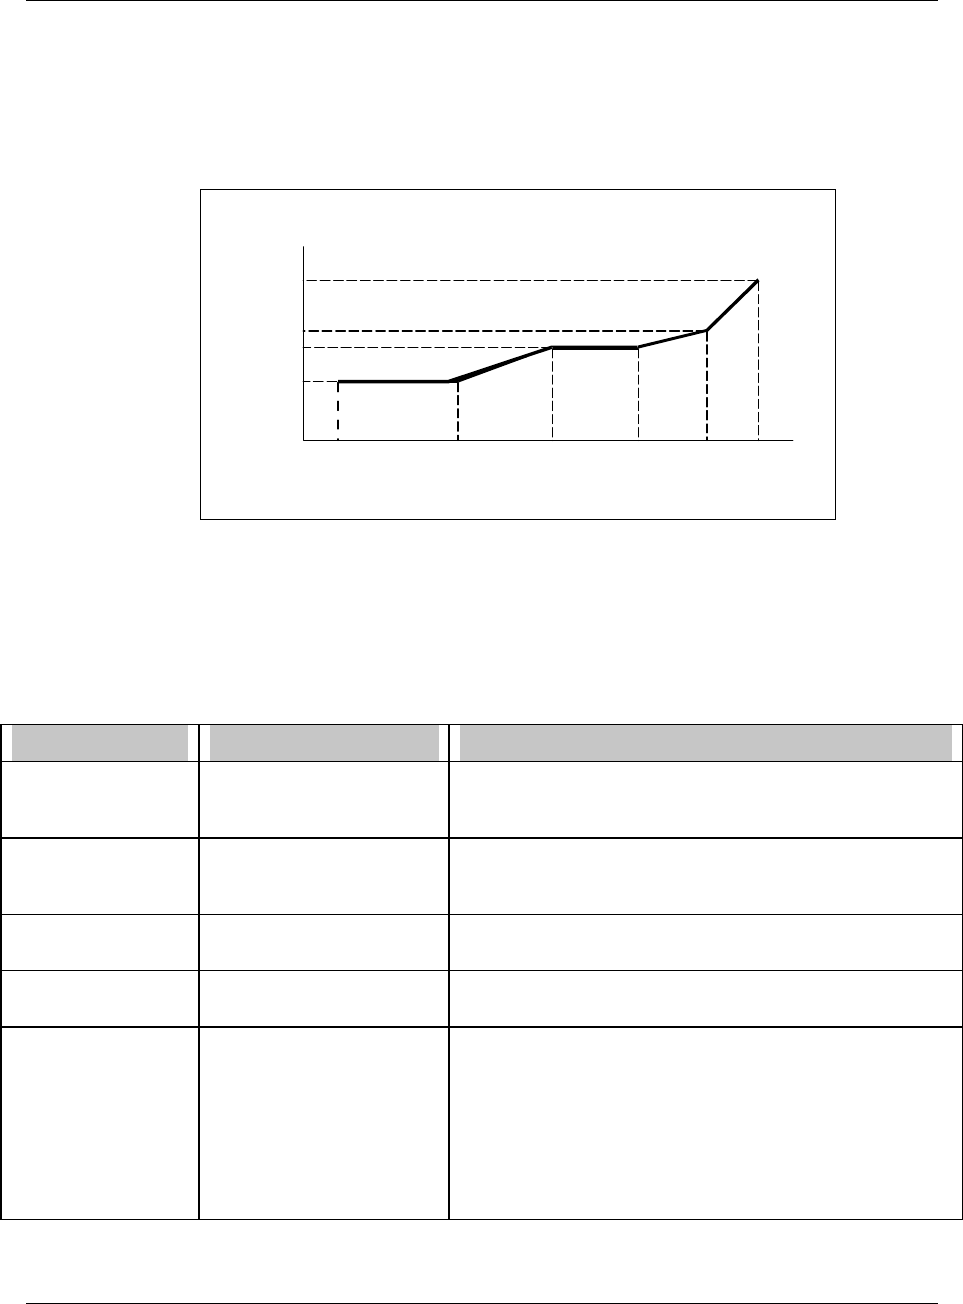
This CV type can be used to characterize a valve (Figure 4-8) or an input signal (Figure 4-9). You enter
a custom curve of up to 19 segments (20 X,Y coordinates). The input is compared with the X values
and its corresponding Y value becomes the output CVn OV. Interpolation between coordinates is
straight line. See Figure 4-7.
If the input value is outside the range of X values, the nearest X value is used, the output will be
clamped to the corresponding Y value and the displayed output value will flash.
X1
X2 X3
X4
X5 X6
Y1, Y2
Y3, Y4
Y5
Y6
Figure 4-7 Function Generator Curve
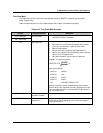
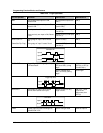
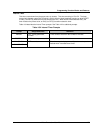
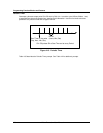
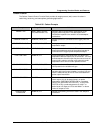
Table 4-33 describes the Function Generator prompts. See Table 4-2 for additional prompts.
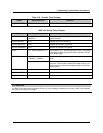
Table 4-33 Function Generator Prompts
Prompt Range/Selections Definition
RANGE LOW OFF or number Enter the output’s lower display limit. Output is not clamped
or flashed when it exceeds this limit. Default value is Y1
value.
RANGE HIGH OFF or number Enter the output’s lower display limit. Output is not clamped
or flashed when it exceeds this limit. Default value is Y1
value.
INPUT OFF, analog parameter,
number
This value will be compared with the X values of the curve.
The corresponding Y value will be the CV output.
X1, Y1, X2, Y2…X20,
Y20
OFF or number Use these prompts to plot a curve using 2 to 20 X,Y
coordinates. X values must increase as Xn increases.
FEEDBACK OFF, analog parameter,
number
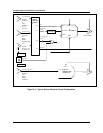
For valve characterization, select AO# BC to propagate the
back calculation (BC) value from a downstream Analog
Output. Also, program the upstream loop’s feedback with
this CV’s back calculation value (CV# BC). See Figure 4-8.
Attention: If feedback is programmed to an analog
parameter or a number, the X and Y values must define a
curve that is not bell shaped or complex. That is, all Y values
must be increasing or decreasing.


