


Online Operations Using Primary Displays
Video Recorder – User Manual 209
6. Online Operations Using Primary Displays
6.1 Overview
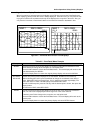
Online operation using primary displays consists of using the buttons to view and interact with the
displays that were assigned to the Display button. Pressing the Display button changes to online mode
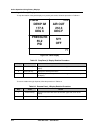
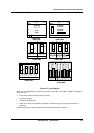
and accesses the displays assigned to this key. Available displays are shown in Figure 4-17 and are
described in Table 6-1. In the following table, interactive means the Tab key can be pressed to access
various functions on the display.
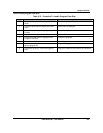
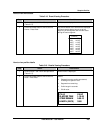
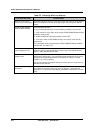
Table 6-1 Displays Accessed With Display Button
Display Definition Function Interactive
or view only?
V_TREND Vertical trend Displays up to 12 points trended vertically. Interactive
VTRNDDIG Vertical Trend Digital Displays up to 12 points. Interactive
VT_6DIV Vertical Trend w/6 Divisions Displays up to 12 points. Interactive
H_TREND Horizontal trend Displays up to 12 points trended horizontally. Interactive
HTRNDDIG Horizontal Trend Digital Displays 12 points trended horizontally. Interactive
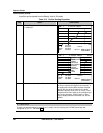
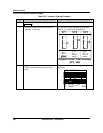
HTRNDBAR Horizontal Trend Bar Displays up to 12 points trended horizontally
with 4 vertical bar graphs to the right.
BAR GRAPH1 = Trend Point 1
BAR GRAPH2 = Trend Point 2
BAR GRAPH3 = Trend Point 3
BAR GRAPH4 = Trend Point 4
Interactive
V_4_BAR 4-point Vertical Bar Graph Displays 4 points. View only
V_6_BAR 6-point Vertical Bar Graph Displays 6 points. View only
V_8_BAR 8-point Vertical Bar Graph Displays 8 points. View only
V_12_BAR 12-point Vertical Bar Graph Displays 12 points. View only
H_4_BAR 4-point Horizontal Bar Graph Displays 4 points. View only
H_6_BAR 6-point Horizontal Bar Graph Displays 6 points. View only
PANEL_4 4-point Panel Displays 4 points. View only
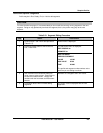
UNIT DATA Unit Data Displays up to 12 point values at a time. View only
PANMETER Panel Meter Displays up to 12 different panel displays. View only
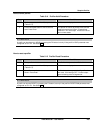
ALARMSUM Alarm Summary Displays current alarms. Interactive
STORAGE Storage Status Displays data storage status. View only
TOTALIZR Totalizer Displays all totalizer values. View only
LOOP_BAR Loop w/Bar Graph Displays a loop’s data as numbers and bar
graphs.
Interactive
LOOP_DIG Digital Loop Displays loop data as numbers only. Interactive
LOOP_2BS Loop w/2 Bar Graphs Displays 2 Loops’ data as bar graphs. Interactive
LOOP_3BS Loop w/3 Bar Graphs Displays 3 Loops’ data as bar graphs. Interactive
LOOP_4BS Loop w/4 Bar Graphs Displays 4 Loops’ data as bar graphs. Interactive
LOOP_8BS Loop w/8 Bar Graphs Displays 8 Loops' data as bar graphs. Interactive
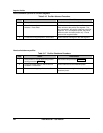
SPP_2BS Setpoint Profiles w/2 Bar
Graphs
Displays 2 Profiles’ data as bar graphs. Interactive
SPP_3BS Setpoint Profiles w/3 Bar
Graphs
Displays 3 Profiles’ data as bar graphs. Interactive
SPP_4BS Setpoint Profiles w/4 Bar
Graphs
Displays 4 Profiles’ data as bar graphs. Interactive
SP_TREND Setpoint Profile Trend Displays a Profile as a Trend. Interactive
TOTAL Totalizer Displays 1 totalizer View only