


I
-
Using
Limit-Line
Functions
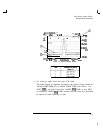
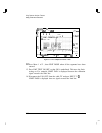
Limit lines provide an easy way to compare trace data to a set of amplitude
and frequency parameters while the cable TV analyzer is sweeping the
measurement range. An upper and/or lower limit line can be displayed.
Every measurement sweep of trace A is compared to the limit lines. If trace
A is at or within the bounds of the limit lines, LIMIT PASS is displayed.
If trace A is out of the limit-line boundaries, LIMIT FAIL is displayed.
Figure 3-4 shows a sample limit-line display.
Limit lines are constructed from a table of frequency and amplitude
coordinate pairs. Limit line segments are created by connecting these
points. Everything except the segment length is defined by the entry
for its beginning point. There are several different ways of entering the
frequency/amplitude pairs. These are described in the following section.
NOTE
Limit lines can only
by
created and edited from the front panel in the format of limit line tables. Limit
lines that are in a trace format can only be created using remote commands or a down-loadable
program. See HP 8590 E-Series and L-Series Spectrum Analyzers and HP
8591C
Cable TV Analyzer
PrugrammerS
Guide for more information.
Though coordinates of frequency and amplitude are used most often,
limit line data can also be entered in terms of time and amplitude. Use
the LIMITS FRQ TIME
softkey,
to underline the desired choice of either
frequency or time parameters. Frequency is the default selection. If TIME is
selected SELECT TIME will replace SELECT FREQ in the Edit Limit menus.
This section provides an overview of limit lines, a procedure for creating
a sample upper limit line, and descriptions of the limit-line functions. A
procedure for creating an upper and a lower limit line is at the end of this
section. Refer to Chapter 6 for more information on a specific limit-line
function.
3-33