


I
-
I
-
Making Basic Measurements Using Spectrum Analyzer Mode
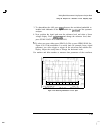
Identifying Distortion Products Using the RF Attenuator and Traces
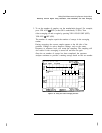
2. Set one source to 300 MHz and the other source to 301 MHz for a
frequency separation of 1 MHz. Set the sources equal in amplitude (in this
example, the sources are set to 44
dBmV).
3. Tune both signals onto the screen by setting the center frequency between
300 and 301 MHz. Then, using the knob, center the two signals on the
display. Reduce the frequency span to 5 MHz for a span wide enough to
include the distortion products on the screen. To be sure the distortion
products are resolved, reduce the resolution bandwidth until the distortion
products are visible. Press
Isw),
RES
BW , and then use the step-down key
(QIJ)
to reduce the resolution bandwidth until the distortion products are
visible.
4. For best dynamic range, set the mixer input level to
-
30
dB
and move
the signal to the reference level: press
CAMPLITUDE),
More 1 of 2 ,
MAX
MXR
LEVEL , 30
I--dB).
The spectrum analyzer automatically sets the attenuation so that a signal
at the reference level will be a maximum of 14
dBmV
at the input mixer.
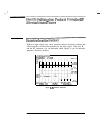
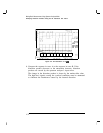
5. To measure a distortion product, press (PEAK SEARCH] to place a marker
on a source signal. To activate the second marker, press MARKER
A
.
Using the knob, adjust the second marker to the peak of the distortion
product that is beside the test tone. The difference between the markers is
displayed in the active function block.
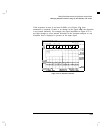
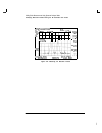
To measure the other distortion product, press
CPEAK
SEARCH],
NEXT PEAK This places a marker on the next highest peak, which, in
this case, is the other source signal. To measure the difference between
this test tone and the second distortion product, press MARKER A and use
the knob to adjust the second marker to the peak of the second distortion
product. (See Figure 4-24.)
4-35