


I
-
I
-
Using Spectrum Analyzer Features
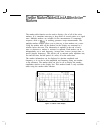
Use the Peak Table to List the Displayed Signals
Example: Use the peak table function to measure the calibrator signal and its
harmonics.
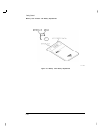
1. Connect the CAL OUT signal to the cable TV analyzer’s INPUT 75
D
and
press [GZGY).
2.
Press [PEAK SEARCH), More 1 of 2 and PK TABLE ON OFF (ON) to turn
on the peak table display.
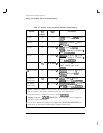
3. The displayed peaks are listed by amplitude with the highest amplitude
signal listed first. The table can be sorted by frequency, instead of
amplitude. In this mode the lowest frequency peak is listed first, with the
others listed in order of increasing frequency. Press PK
SORT
FRq
AMP to
underline FRQ and list the signals by frequency.
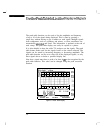
4. The harmonics are numbered on the display in order of their listing in
the peak table. The table can be limited to list only the signals above a
certain power level. Change the peak table from the normal mode to the
display line mode by pressing PK MODE
0DL
NRM to underline
>DL.
The
knob can then be used to move the display line to identify only the desired
peaks above the display line.
5. Press PK MODE
<>DL
NRM again to underline < DL and move the display
line to identify only the peaks that fall below the display line.
NOTE
The peak table data can be printed by pressing the
[CEF)
key
The peak table cannot be saved or recalled.
3-7