


Model 9110T NOx Analyzer EPA Protocol Calibration
Teledyne Analytical Instruments 232
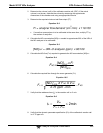
4. While maintaining all other conditions, adjust the ozone generator to obtain several
other concentrations of NO
2
evenly spaced between the 80% URL point and the
zero point. Record the NO, NO
X
, and NO
2
concentrations for each additional point.
5. Calculate the resulting NO
2
concentrations as follows:
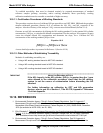
Equation 10-10
F
]
NO
[*
F
+
]
[NO-
]
[NO =
]
NO
[
T
IMP
2
NO
REMORIGOUT
2
Where [NO]
ORIG
is the NO concentration before the GPT ozone is turned on, and [NO]
REM
is the NO
remaining after GPT.
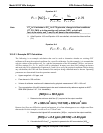
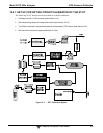
Plot the NO
2
concentration output by the instrument on the y-axis against the generated NO
2
[NO
2
]
OUT
on the x-axis. The plot should be a straight line within the ± 2% linearity criteria given for the NO
x
and
NO channels. If the plot is not linear, the most likely cause is that the converter needs replacing. See
Section 9.1.4 on NO
2
converter efficiency and Section 11.3.8 for changing the converter if needed.
10.8. OTHER QUALITY ASSURANCE PROCEDURES
Precision is determined by a one-point check at least once every two weeks. Accuracy is determined by a
three-point audit once each quarter.
Essential to quality assurance are scheduled checks for verifying the operational status of the monitoring
system. The operator should visit the site at least once each week. Every two weeks a Level 1 zero and
span check must be made on the analyzer. Level 2 zero and span checks should be conducted at a
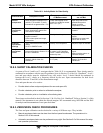
frequency desired by the user. Definitions of these terms are given in Table 10-2.
10.8.1. SUMMARY OF QUALITY ASSURANCE CHECKS
The following items should be checked on a regularly scheduled basis to assure high quality data from
the 9110T. See Table 10-3 for a summary of activities; also the QA Handbook should be checked for
specific procedures.