


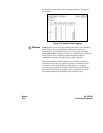
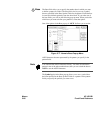
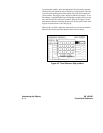

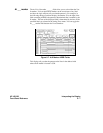

The waveforms area displays the data the timing analyzer acquires. The
data is displayed in a format similar to an oscilloscope with the horizontal
axis representing time and the vertical axis representing amplitude. The
basic difference between an oscilloscope display and the timing
waveforms are: the vertical axis only displays highs (above threshold) and
lows (below threshold); lows are represented by a darker line for easy
differentiation.
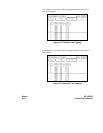
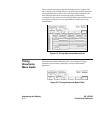
Timing
Waveforms
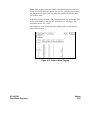
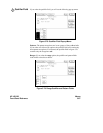
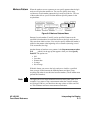
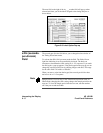
Menu Fields
The menu area contains fields that allow you to change the display
parameters, place markers, and display waveform measurement
parameters.
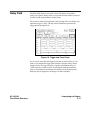
Figure 6-2. Timing Waveforms Menu with 24
Figure 6-3. Timing Waveforms Menu Fields
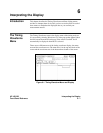
Interpreting the Display HP 16510B
6 - 2 Front-Panel Reference