


The Label Value
vs.
States Chart
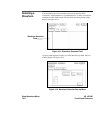
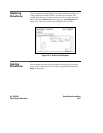
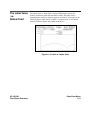
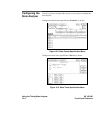
The Label Value vs. State chart is a plot of label activity versus the
memory location in which the label data is stored. The label value is
plotted against successive analyzer memory locations. For example, in the
following figure, label activity of POD 1 is plotted on the Y axis and the
memory locations (States) are plotted on the X axis.
Figure 11-2. Label vs. States Chart
HP 16510B State Chart Menu
Front-Panel Reference 11-3