


3. Preliminary Display Adjustments (SN 3004A and Above)
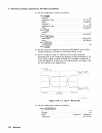
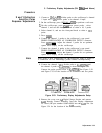
12. Set the oscilloscope controls as follows:
Press
[CHAN]:
Channel 1....................................................on
amplitude scale
......................................
10.0
V/div
offset................................................25.000 0 V
Channel 4....................................................on
amplitude scale
......................................
10.0
V/div
offset................................................60.000 0 V
Press (TRIG):
source.........................................................1.
level.................................................25.0000 V
Press
[TIME):
time scale . . . . . . . . . . . . . . . . . . . . . . .
.._....__..........
50.0
ns/div
delay . . . . . . . . . . .. . . . . . . . . . . . . .. . . . . . . . . . . . . . . 125.000 ns
Press (DISPLAY):
connect dots . . . . . . . . . . . . . . . . . . . . . . . . . . . . . . . . . . . . . . . . . . . . . . . ..on
Press
ISHOW].
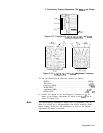
13. Set the spectrum analyzer’s front-panel INTENSITY control fully
counterclockwise, and then set the LINE switch to ON.
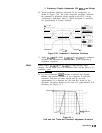
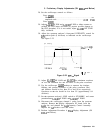
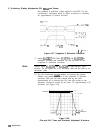
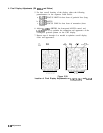
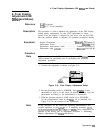
14. The X+ deflection and X- deflection waveforms should be
superimposed on the oscilloscope display, as shown in Figure 3-26.
If necessary, adjust
AlA2R227 X POSN and AlA2R220 X GAIN
for a centered display of at least four vertical divisions. See
Figure 3-25 for the location of the adjustments.
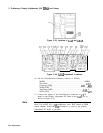
hf
running
8..
-125.000
ns
1
10.0
V/div
offset:
25.00 V
10.00 :
I
dc
4
10.0
V/div
offset:
60.00 v
10.00
:
I
dc
1
f
25.00 V
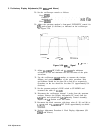
Figure 3-26. X + and X- Waveforms
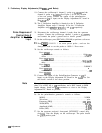
15. Set the oscilloscope controls as follows:
Press
[WFORM MATH):
fl
. . . . . . . . . . . . . . . . . . . . . . . . . . . . . . . . . . . . . . . . . . . . . . . . . . . . . . . . . .
..on
display . . . . . . . . . . . .. .. .. .. .. . .. .. .. . . . . . . . . . . . . . . . . . . .. .. on
math . . . . . . . . . . . . . . . .. . . . . . . . . . . channel 1
-
channel 4
sensitivity
. . . . . . . . . . . . . . . . . . . . . . . . . . . . . . . . . . . . . . . . ...25.0
Vldiv
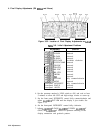
16. Three waveforms should be displayed on the oscilloscope, as
shown in Figure 3-27. The lower composite waveform represents
Adjustments 3-55