


17. Line-Related
Sidebands Tests
Specification
95
dB
below the peak of a CW signal. Option
$00:
>75
dB
below
the peak of a CW signal.
Description
The spectrally pure calibrator signal of the spectrum analyzer is
applied to the analyzer input and the line related sidebands near the
signal are measured.
Equipment
None required
Procedure
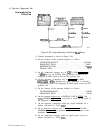
1.
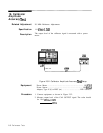
Press ~NSTR PRESET) on the analyzer. Connect CAL OUTPUT to
SIGNAL INPUT 2.
2.
3.
4.
5.
6.
7.
Press
C-j
8 and adjust AMPTD CAL for a MARKER amplitude
of -10.00 dBm
f0.02
dB.
Press
(~NSTR
PRESET).
Key in the following analyzer settings:
[CENTER FREQUENCY)
.20
MHZ
[REFERENCE LEVEL] . . . . . . . . . . . . . . . . . . . . . . . . . . . . . . . . . . . . . -10 dBm
CFREQUENCY
SPAN]
....................
600 Hz
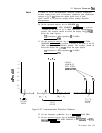
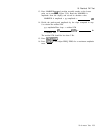
Wait for completion of sweep, then press MARKER
[PEAK
SEARCH),(jj).
Press (SHIFT)
(-1
G,
SWEEP
@‘i7ZZ],
10
(j-/Iv
to initiate
video averaging of 10 sweeps. Wait for completion of sweeps.
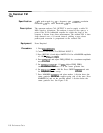
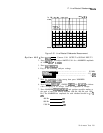
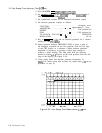
Press MARKER
(PEAK
SEARCH],(~)
and position movable marker at
the peak of each line related sideband (120 Hz, 180 Hz, and 240 Hz
for 60 Hz line frequency; 100 Hz, 150 Hz, and 200 Hz for 50 Hz
line frequency, etc.). The MARKER A amplitude for each sideband
should be
c-85
dB
(see Figure 2-31).
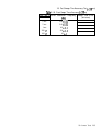
120 Hz (100 Hz)
dB
180 Hz (150 Hz)
dB
240
Hz (200 Hz)
dB
2-60
Performance Tests