


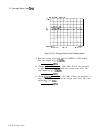


15. Spurious Responses Test
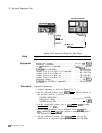
24. On the frequency synthesizer, readjust the signal amplitude as
necessary to position the peak of the displayed 29.99 MHz signal
at the top CRT graticule line.
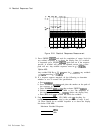
25. On the spectrum analyzer, key in MARKER
@,
(CENTER FREQUENCY) 30.01 MHz, MARKER (PEAK SEARCH) to
position a second marker at the peak of the 30.01 MHz third-order
intermodulation product. The response should be below the
display line
(>70
dB
below the input signals).
TO1
Distortion (10 kHz separation
@
30 MHz)
dBm
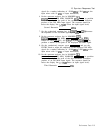
26. On the spectrum analyzer, key in [CENTER FREQUENCY) 29.98 MHz,
MARKER
[PEAK SEARCH) to position a second marker at the peak
of the 29.98 MHz third-order intermodulation product. The
response should be below
the display line
(>70
dB
below the
input signals).
TO1
Distortion (10 kHz separation
@
30 MHz)
dBm
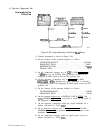
27. On the synthesized sweeper, press (POWER LEVEL] and decrease
the amplitude of the 30 MHz signal by 13.0 dB from the current
setting.
28. On the frequency synthesizer, key in
[FREQUENCY] 29 MHz,
(AMPLITUDE] and then decrease the amplitude of the 29 MHz signal
by 13.0
dB
from the current setting.
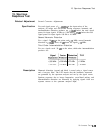
29. Set the controls of the spectrum analyzer as follows:
CENTER FREQUENCY . . . . . . . . . . . . . . . . . . . . . . . . . . . . . 29 MHz
FREQUENCY SPAN . . . . . . . . . . . . . . . . . . . . . . . . .
,500
Hz
REFERENCE LEVEL . . . . . . . . . . . . . . . . . . . . . . . . . . . . . . -33 dBm
MARKER . . . . . . . . . . . . . . . . . . . . . . . . . . . . . . . . . . . . . . . . . . . OFF
30. On the spectrum analyzer, key in DISPLAY LINE
[ml
-105
dBm, MARKER
CPEAK
SEARCH) to position a marker on the peak of
the displayed 29 MHz signal.
31. On the frequency synthesizer, adjust the signal amplitude for a
marker indication of -33.0
dBm.
32. On the spectrum analyzer, key in
CCENTER
FREQUENCY) 30 MHz,
MARKER [PEAK SEARCH) to position a marker on the peak of the
displayed 30 MHz signal.
33. On the synthesized sweeper, adjust the signal power level for a
marker indication of -33.0
dBm (total signal power of -40 dBm
at the input mixer with 10
dB
of input attenuation).
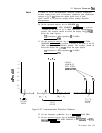
34. On the spectrum analyzer, key in MARKER
a,
[CENTER FREQUENCY) 1 MHZ, MARKER [PEAK SEARCH] to position
a second marker at the peak of the 1 MHz second-order
intermodulation distortion product. The response should be below
the display line
(>75
dB
below the total input power).
SO1
Distortion (1 MHz separation
@
30 MHz)
dBm
2-54 Performance Tests