


Teledyne API – T101 Operation Manual Calibration Procedures
185
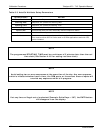
6.10. CALIBRATION QUALITY
After completing one of the calibration procedures described above, it is important to
evaluate the analyzer’s calibration slope and offset parameters. These values describe the
linear response curve of the analyzer. The values for these terms, both individually and
relative to each other, indicate the quality of the calibration. To perform this quality
evaluation, you will need to record the values of both test functions (Section 4.2.1 or
Appendix A-3), all of whi
ch are automatically stored in the DAS channel CALDAT for
data analysis, documentation and archival.
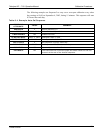
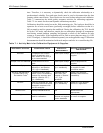
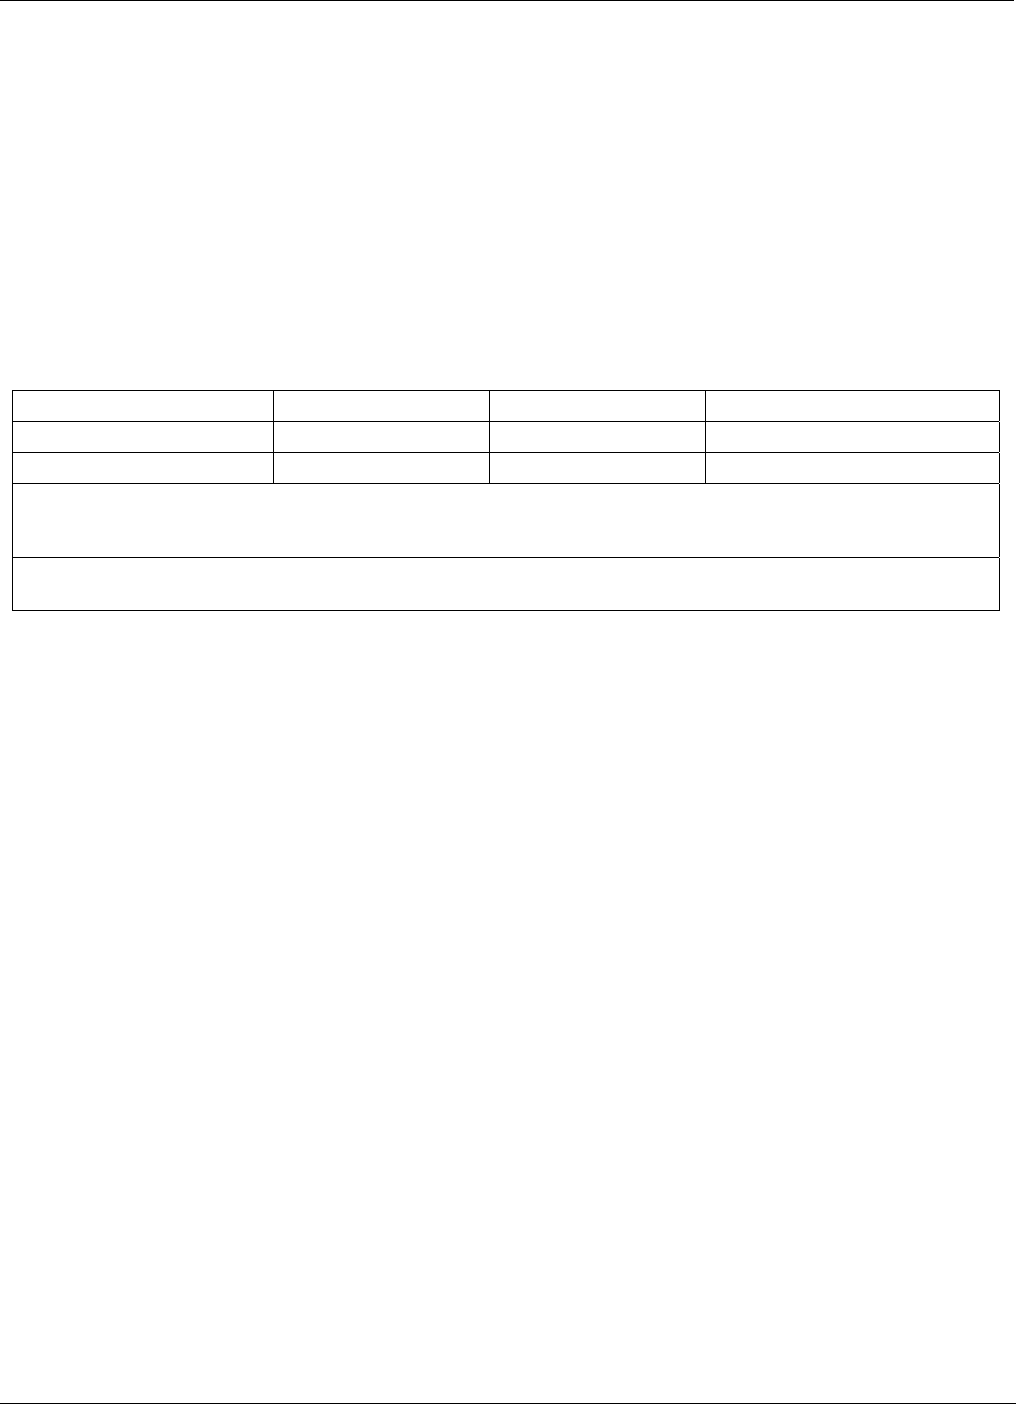
Make sure that these parameters are within the limits listed in Table 6-5.
Table 6-5. Example Auto-Cal Sequence
FUNCTION MINIMUM VALUE OPTIMUM VALUE MAXIMUM VALUE
H2S SLOPE
1
-0.700 1.000 1.300
H2S OFFS
1
-50.0 mV <100 250.0 mV
These values should not be significantly different from the values recorded on the Teledyne API Final Test
and Validation Data sheet that was shipped with your instrument. If they are, refer to the troubleshooting
Section 9.
1
Shown as they appear when analyzer is in H
2
S mode. In SO
2
mode they appear as SO2 OFFS & SO2
SLOPE. In multigas mode, both versions are listed and should be checked
07266B DCN6485