


DEFINITY ECS Release 8.2 Maintenance for R8.2csi
555-233-119 Issue 1
April 2000
Maintenance Commands
2-169monitor system
2
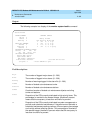
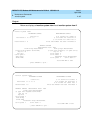
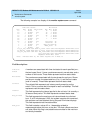
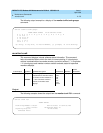
The following example is a display of the
monitor system conn
command.
Field descriptions
Time Slot
Status
4 numbers are associated with time slot status for each specified pnn;
the two buses (0 and 1) have a maintenance and a normal state, and a
number of idle counts. These fields represent real-time status data.
Bus Status
Two numbers are associated with the two buses for each pnn. Shown
are the pnn number; the associated bus (0 or 1); and the bus’s state
(avail or unavail). These fields represent real-time status data.
Callrate
The callrate field represents call rates currently executing on the
switch. This is a counter that is bumped for each call attempt. This field
represents real-time status data.
Interval
This field represents the interval applied to the call rate. It is normally a
36 second time period. This field represents constant status data.
Max_callrate
This field represents the maximum call rate achieved since the last
hour. If, at 20 minutes past 12:00, the system executes this command,
the maximum call rate obtained during the past 20 minutes displays.
This field represents real-time status data.
Next_hour
This field contains a value of 0 or 1 depending related to
measurements taken this hour or the next. This hour reflects maximum
call rates. When this flag is set, statistics accumulate for the next hour
and shortly thereafter.
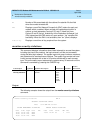
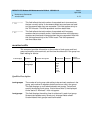
Time Slot Status Bus Status
Pnn Bus State *Idle Count Pnn Bus State
10 0 Maint 0 10 0 Avail
10 1 Normal 233 10 1 Avail
10 0 Maint 0 22 0 Avail
10 1 Normal 233 22 1 Avail
22 0 Maint 0 1 0 Avail
22 1 Normal 233 1 1 Avail
22 0 Maint 0
22 1 Normal 233 *Callrate: 20
1 0 Maint 0 *Interval: 60
1 1 Normal 233 *Max_callrate:45
1 0 Maint 0 *Next_hour: 70
1 1 Normal 233
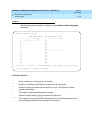
tot_ts_req :0F24 0000 3CE2 ts_count :0010 0920 0200 Requests-TN748 TTRs :0014
ts_denied :0E46 3CE2 0000 ts_total :0000 0090 0028 Requests-TN748 CPTRs:0041
tot_fts_req:0000 53D2 2231 fts_count:02E0 0910 0784 Requests-TN744 CPTRs:0082
fts_total:0320 0192 7048 Requests-TN744 TTRs :0082
Requests-TN744 MFCs :0082
Note: * Denotes Base 10, All Other Figures are in Base 16